Quantcast
Channel: ComponentSource News | Infragistics Ultimate UI for Windows Forms
Viewing all 64 articles
Browse latest View live

Infragistics Ultimate UI for Windows Forms 18.1 Build 18.1.20181.237

$
0
0
Infragistics Ultimate UI for Windows Forms

Improves the Chart, Grid, SpreadSheet and Schedule controls.

Fixes

  • AppStylist
    • App styling is not applied to "fx" in the selected tab of the formula builder.
  • Chart
    • Application slowdown when quickly changing series brush.
    • Legend are not getting updated when changing the datasource.
    • LegendItemMouse events do not work in Windows Forms.
  • Combo
    • Vertical scrollbar is shown even when not needed.
    • Exception when Returning False from ShouldDisplayText on UltraDropDown and dropping down an AddNewRow cell.
  • DataChart
    • In the DataChart setting the interval value hang the application.
    • Out Of Range Exception when adding Series to DataChart.
    • Arrow pointer on the CategoryTooltipLayer is fuchsia.
    • LinearGradientBrushes do not draw in the Legend.
  • Excel
    • Assert: "This is unexpected" when loading a Workbook with a Fill Color Sort.
    • Excel Library throwing NullReferenceException' exception.
  • Grid
    • Binding the grid to a datasource with over 20,000 columns takes a long time.
    • NullReferenceException occurs with pressing tab key.
    • AutoSizing a column that is using a FormattedTextEditor and a DataFilter is not AutoSizing correctly based on the displayed text.
    • Depending on the column order of disabled columns, TemplateOnTopWithTabRepeat may not work correctly.
    • Grid showing misalignment , appears scrambled after new cell validation.
    • Exception encountered when interacting with property grid.
    • Using the WrapHeaderText property hang the application in version 18.1.20181.177.
    • Memory leak exists when using the same instance of an editor in a column in the UltraGrid.
    • Grid designer crashes if you attempt to add a child band when there is an existing column that has the same key.
  • RadialGauge
    • Incorrect needle position.
  • Schedule
    • Incomplete date being displayed on a UltraTimelineView for Japanese culture.
  • SpreadSheet
    • ArgumentOutOfRangeException in Infragistics.Win assembly with frozen row.
    • ArgumentOutOfRangeException when pasting in Type field (Format cells dialog).
    • ArgumentOutOfRangeException when changing Sort on with deleted Sort by column.
    • ArgumentOutOfRangeException on Cut/Paste - Infragistics.Documents.Excel.Worksheet.GetColumnPosition(Int32 columnIndex).
    • Shrink to Fit not applied after Sort Left to Right.
    • NRE in format cells dialog after choosing Custom with empty Type.
  • TabControl
    • UltraTabControl throwing ArgumentOutOfRangeException when TabLayoutStyle set to MultiRows.
  • Toolbars
    • UltraToolbarsManager throwing InvalidOperationException exception for empty tabs.
  • ToolbarsManager
    • Shortcut text for popup menu tools are misaligned.

Infragistics Ultimate UI for Windows Forms 18.2

$
0
0
Callouts Annotation

Annotate important data points in your charts.

Features

Infragistics Excel Engine Features

  • Chart Support - With support for 70 different chart types, you can now create dashboard reports that visualize data in a clear and easily digestible manner. This brand-new Excel Charting API gives you complete control over how your charts are rendered with the ability to include a legend, a title, axis titles, and a vast number of options for styling such as gridlines, tick marks, colors and more. You have the full power of Excel charts at the tips of your fingers. The best part, you don’t even need to have MS Excel installed Adding a chart to an Excel document is easy. Using the Infragistics Excel Library, create or get an instance of the Worksheet object, and then simply call the AddChart method on the Shapes collection. Supply the type of chart you wish to create (choose from 70), provide the size and location of the chart, and then provide the data and any other formatting settings you want to apply to the chart.
  • Sparklines - The Excel Engine now supports adding line, column and stacked Sparklines to an Excel Worksheet. Note, the XLSX file format is required.

UltraSpreadsheet Features

  • Format Cells Dialog - The UltraSpreadsheet lets you change many of the ways it displays data in a cell. For example, you can specify the number of digits to the right of a decimal point, or you can add a pattern and border to the cell. You can access and modify the majority of these settings in the Format Cells dialog box (right-click the cell and select Format Cells).
  • Number Tab - By default, all worksheet cells are formatted with the General number format. With the General format, anything you type into the cell is usually left as-is. For example, if you type 36526 into a cell and then press ENTER, the cell contents are displayed as 36526. This is because the cell remains in the General number format. However, if you first format the cell as a Currency, then the number 36526 will be displayed as $36,526.00.
  • Alignment Tab - You can position text and numbers, change the orientation and specify text control in cells by using the Alignment tab.
  • Font Tab - The term font refers to a typeface (for example, Arial), along with its attributes (point size, font style, underlining, color, and effects). Use the Font tab in the Format Cells dialog box to control these settings. You can see a preview of your settings by reviewing the Preview section of the dialog box.
  • Border Tab - In Excel, you can put a border around a single cell or a range of cells. You can also have a line drawn from the upper-left corner of the cell to the lower-right corner, or from the lower-left corner of the cell to the upper-right corner. You can customize these cells' borders from their default settings by changing the line style, line thickness or line color.
  • Fill Tab - Use the Fill tab in the Format Cells dialog box to set the background color of the selected cells. You can also use the Pattern list to apply two-color patterns or shading for the background of the cell.
  • Protection Tab - The Protection tab allows you to lock your worksheet to protect your data and formulas. This option does not take effect unless you also protect your worksheet.
  • Custom Sort Dialog for UltraSpreadsheet - Since sorting is so important in any Excel document, a Custom Sort Dialog has been added to give you full control over how you want to sort your Excel data. For example, if you have a Department column and an Employee column, you can first sort by Department (to group all the employefes in the same department together), and then sort by name (to put the names in alphabetical order within each department).
  • Top 10 Filter Dialog - When you filter a list using the Top 10 feature, only the top number or the top percent of records remain. You can also filter to display the bottom number or the bottom percent of records. For example, if you want to list the top wage earners in the company, you can filter the Salary column to display only those records with the top ten salaries. If you filter for the top ten percent of wage earners, however, your list would include only those personnel whose salaries together equaled ten percent of the total. Although called Top 10, you can filter for any number or percentage of items you desire.
  • Filtering and Sorting Improvements - In 18.1, the AutoFilter dropdown was added to the spreadsheet. The dropdown had menu items for sorting ascending/descending, clearing a filter applied to the column and to apply a numeric/date/text filter. However, it didn’t have a way to apply a sort or filter based on the forecolor, fill or icon. In 18.2, that dropdown contains items to allow filtering or sorting based on the foreground, fill or icon of the cells within that column.
  • Deselect a Selection - Sometimes when you’re selecting multiple cells or ranges in Excel, you accidentally select one or more that you didn’t intend. Now you can deselect any cells within the selected range with the Deselect Feature. Pressing the Ctrl key, you can click, or click-and-drag, to deselect any cells or ranges within a selection. If you need to reselect any of those cells, continue holding the Ctrl key and reselect those cells.

UltraCategoryChart

  • Callouts Annotation - With the Callouts Annotation, you can annotate important data points in Category Chart or even customize values in callout boxes based on your logic. For example, calculate maximum values in your data source.
  • Crosshairs Layer - You can configure crosshairs to display as horizontal line, vertical line or both lines at the location of the mouse cursor. In addition, the Crosshairs Layer can show values of data points at the location of the mouse cursor and render these values in colored boxes over the X-Axis and Y-Axis labels.
  • Final Values Annotation - In Category Chart, you can use the Final Values annotation to show values of the last data point in your data source(s). This annotation is rendered as a colored box for each data source over the Y-Axis labels.
  • Highlight Layers - The Category Chart can display two new highlight layers when a user hovers over plotted data points.
    • Category Highlight Layer renders a vertical rectangle that stretches from the start to end of the category that is closest to the mouse cursor. This rectangle is filled with semi-transparent gray color by default.
    • Item Highlight Layer renders a vertical rectangle for each data item in a category that is closest to the mouse cursor. This rectangle is filled with semi-transparent color that matches color of the series by default.
  • Tooltip Types - The Category Chart has a new ToolTipType property that adds two new types of tooltips:
    • Category Tooltip which renders the combined tooltips for all series in data category
    • Item Tooltip which renders individual tooltip for each series in data category

UltraDataChart

  • Callouts Layer - Callouts Layer is a new feature of Data Chart that you can use to annotate important data points or display their values. Callouts Layer can target multiple data series or individual data series. Also, you can customize appearance of these callout layers and bind callout labels to data items or calculate changes between consecutive data points.
  • Crosshairs Layer - In Crosshair Layer has a new annotation feature can now show values of data points at the location of the mouse cursor and render these values in colored boxes over the X-Axis and Y-Axis labels.
  • Final Values Layer - Final Values Layer is a new annotation layer that shows values of the last data point in your data source(s). This annotation is rendered as a colored box for each data source over the Y-Axis labels

Infragistics Ultimate UI for Windows Forms 18.2 Build 18.2.20182.175

$
0
0
Infragistics Ultimate UI for Windows Forms

Improves the DataChart, Grid and Excel controls.

Fixes

DataChart

  • SeriesMouseRightButtonDown and SeriesMouseRightButtonUp events are not available in WinForms.
  • Tooltip text is not displayed if the content is modified at Series.TooltipContentUpdating event.
  • RadiusX and RadiusY of the series have no affect on founding the corners of column series.

DataSource

  • Key already exists error when changing DataType for a column added in the designer.

DockManager

  • Tree doesn't update scroll position when resizing floating pane when "Show window contents while dragging" is disabled.

Excel

  • Unable to unlock/unprotect excel worksheet with password set to more than 15 characters.
  • When scaleing is not at 100% images do not fill full height of cell.

Grid

  • Cell Click event doesn't get fired after zooming the grid.
  • Region scroll speed is slow when scrolled to the bottom and the last visible row is a different size than the other rows.
  • Zoomed Grid has scrambled overlay and not shwing up all the rows.
  • Customizing RowFilterDropDownBlanksItem esource string reset back to its default value.

NavBar

  • UltraOfficeNavBar not able to set the width all the way across the width of the form.

PivotGrid

  • System.Exception is thrown at FlatDataSource.GenerateCube() if the itemsource class has a super class.
  • OlapDataSelector does not populate when DateTime field is nullable.

SpreadSheet

  • My data has headers option in Custom sort dialog does not sort correctly.
  • FormatException: One of the identified items was in an invalid format.
  • Spreadsheet is sending the wrong region to the sort dialog when you show the dialog from a cell inside the sort region and sorting is applied to columns.

SyntaxParsing

  • Text tokens are not properly generated given a certain sql script.

ToolbarsManager

  • RibbonGroupItem has a checked or  mouse down state that is not covered in the available Appearances or AppStyling states.

Infragistics Ultimate UI for Windows Forms 19.1

$
0
0
Infragistics Ultimate UI for Windows Forms

Now renders any Excel document containing charts.

Features

Excel Library

  • The Excel Library now has the ability to create combination charts.

Spreadsheet

  • Load any Excel document containing a chart and it will render.

Infragistics Ultimate UI for Windows Forms 19.1 Service Release

$
0
0
Infragistics Ultimate UI for Windows Forms

Improves Spreadsheet, Grid and Toolbar controls.

Fixes

Combo

  • NullReferenceException when opening the form designer in VS if the form has an UltraCombo on it.

DockManager

  • Menu opens in normal position.
  • Highlight area and actual dock position do not match.
  • Office 2003 grab handle element is not mirrored.
  • Dropdown button disappears or does not function in caption style VC6.
  • The window is not mirrored in VisualStudio2008.
  • Highlight area tab region and actual position of the tab do not match.
  • Highlight area and actual position do not match with DragWindowStyle.LayeredWindowWithIndicators.
  • The indicators appear outside of the form on floating a control.

Editors

  • Binding with Turkish culture tr-TR throwing NullReferenceException.

Excel

  • Some text format of a text box get lost after loading and saving an Excel file.
  • When loading a workbook with a control inside, loading it and saving it to another workbook does not retain the control's information.
  • NameReference.ReferencedRegion returns null on first time query.
  • When loading a workbook that has a hyperlink with an address greater than 256 characters, an ArgumentException is thrown.
  • FormulaParseException thrown when loading a workbook that contains a function SUBTOTAL that targets a cell with the # sign or 102-105, 107, or 109-111.
  • Not supported exception on loading a workbook with charts in dot net core 3.

Geographic Map

  • Hovering a map with a Stacked100BarSeries added throws Null Reference Exception.

Grid

  • Icon sizes don't scale according to font size.
  • Pin Icon are blurry.
  • In some scenario IsInputKey throwing a NullReferenceException.
  • The arrows for the child field are on the left edge of the group by area.
  • Incorrect selection behavior in card view.

Spreadsheet

  • ArgumentException 'Infragistics.Win.DataVisualization.CategoryXAxis' cannot be converted to type 'Infragistics.Win.DataVisualization.NumericXAxis'.
  • Column is truncated.
  • Conditional formatting is not resolved correctly when applied to multiple separate regions.
  • Setting WindowOptions.TabBarVisible to false leaves visible margins.
  • Legend area height is stretched unnecessarily in WinForms.
  • ArgumentOutOfRangeException on clearing data for Stock charts.
  • CategoryScale category axis displays date.

Toolbars

  • MouseWheel doesn't work sometimes with the Ribbon tab and certain mice.

ToolbarsManager

  • Hide certain keyboard shortcuts in Customize dialog. A new ExcludedShortcuts property has been added to the event args for the BeforeDisplayCustomizeDialog that can be used to list which Shortcuts are to be excluded from the shortcut list on the Customize Keyboard dialog.

Win

  • PeekPopup ContentControl is being disposed.

ZoomPanel

  • UltraZoomPanel positions Anchored controls incorrectly.

Infragistics Ultimate UI for Windows Forms 19.2

$
0
0
Infragistics Ultimate UI for Windows Forms

Adds support for .NET Core 3.

Features

.NET Core 3 for Microsoft Visual Studio 2019

  • Now includes full support for .NET Core 3 in Windows Forms. This allows Visual Studio developers to leverage the most modern .NET capabilities for web, rich client, IoT, artificial intelligence and machine learning apps. From a developer perspective, you’ll see immediate improvement in what you can achieve with a smaller, lighter-weight .NET Framework. With Infragistics Ultimate 19.2, you can modernize your web and desktop applications and gain better performance while working with the latest .NET Core CLI tools and SDK-style projects in Visual Studio. Other advantages include the ability to code against the latest C# language features, take advantage of XAML islands, provide side-by-side deployments, and more.

Infragistics Ultimate UI for Windows Forms 19.2 Build 19.2.20192.302

$
0
0
Infragistics Ultimate UI for Windows Forms

Improves Grid, Editor and GanttView controls.

Fixes

DockManager

  • StackOverflowException thrown when initializing TabGroup panes.
  • Context menu does not open on child form header.

Editors

  • Line alignment aligns when the parent is clicked.
  • Insert image is missing.

Excel

  • IndexOutOfRangeException is thrown when loading an xls file that doesn't have any FONT records.

ExplorerBar

  • UltraWinExplorerBar image options do not change from the context menu

Formatted TextEditor

  • Setting the Customized Resouce String for the Raw Text Context Menu doesn't not change the text of the items in the context menu.

GanttView

  • Different menu item behavior in DNF and NC 3.1.
  • Context menu opens in the middle of the app with Shift F10.
  • Hotkeys do not work in DNF with Shift F10.

Grid

  • When column has a spell checker set and typing a long value the input doesn't follow the inputted text so you can't see what is being input.
  • Arrow keys don't work to modify value to the right of the decimal place.
  • Filtering doesn't filter out records if the column's bound data is of DateTime type.
  • FilterConditions in the CustomFilter dialog are not reflected in the filter dialog.
  • Redundant designer serialization of UltraGridColumn.Header.Editor = null for every column.
  • Filtered-in records are none or not all of the selected data if the column's bound data is of Double type and if more than two items are selected in the filter dialog.
  • Filter check mark disappears when 3 items are selected.
  • Not in condition does not filter out.

PDF

  • Embedded fonts in a PDF report are not displayed when using Mac Preview or iOS Safari to view the document.

Spreadsheet

  • License error when trying to put a 19.2 Spreadsheet on a form in DEBUG build.
  • Context menu does not open when cell is in edit mode.

TabbedMdi Manager

  • ArgumentException in TabbedMdiManager in NC 3.0.

Infragistics Ultimate UI for Windows Forms 20.1

$
0
0
Infragistics Ultimate UI for Windows Forms

Adds support for .NET Core 3.1.

Features

  • Added support for .NET Core 3.1.

Infragistics Ultimate UI for Windows Forms 20.1 Build 20.1.20201.42

$
0
0
Infragistics Ultimate UI for Windows Forms

Improves DataChart, Editors and Grid controls.

Fixes

Combo

  • UltraGridFilterUIProvider invokes incorrect resizing of UltraCombo DropDown area.

DataChart

  • Markers on the chart do not match when setting the outline on series markers.
  • Memory leak when using callout layer.
  • Callout layer labels group together at edge after a few seconds.

DockManager

  • Setting AllowDrop does not cause property changed event.

Editors

  • Validating UltraTextEditor fired twice.
  • Resetting grid palette row separator appearance does not cause property changed event.

Microsoft Excel

  • Error loading worksheet with chart.

Grid

  • No exception is thrown on adding columns with equal keys in UltraGrid.
  • FilterUIProvider Close (true) does not apply changes.

Label

  • Memory leak occurs when appearance property is changed.

ListView

  • UltraListView lasso selection behavior only works for items in view.

OfficeNavBar

  • Infragistics.Win.UltraColorPalette.GridPaletteRow sub object property errors.

Panel

  • Resetting ContextMenu does not cause property changed event.

TabbedMdiManager

  • Drop indicator remains when an MDI child form is dragged (Microsoft Windows 10 1903 and multi-display environment).

ToolbarsManager

  • Resetting "always show menus expanded" does not cause property changed event.
  • US international keyboard inputs are not working as expected with UltraToolbarManager.

Infragistics Ultimate UI for Windows Forms 20.1 Build 20.1.20201.42

$
0
0
Infragistics Ultimate UI for Windows Forms

Improves FormattedTextEditor, CalcManager and DockManager.

Features

  • FormattedTextEditor
    • There are now separate resource strings/properties for the menu item and the tooltip.
    • Added new Tool Caption Strings.
    • Added new ToolTip Strings.

Fixes

  • CalcManager
    • UltraCalcException occurs if you put the custom combo (inherits UltraCombo) and UltraCalcManager together on the form.
  • Combo
    • UltraGridFilterUIProvider invokes incorrect resizing of UltraCombo DropDown area.
  • DayView
    • The last time slot no longer scrolls when dragging an appointment.
  • DockManager
    • Error message that the "AllowDrop property is set to true but the ApartmentState of the current thread does not support drag drop" in UltraDockManager.
  • Microsoft Excel
    • NameReference.ReferencedRegion returns null on first time query.
  • ExplorerBar
    • Context Menu appears larger.
    • Schedule
      • UltraCalendarInfo.GetAppointmentsInRange finds non-existent occurrences out of range.
    • SpreadSheet
      • Some culture-specific formats are not applied properly.

    Infragistics Ultimate UI for Windows Forms 20.2

    $
    0
    0
    Infragistics Ultimate UI for Windows Forms

    Adds Microsoft .NET 5.0 support.

    Features

    • Added Microsoft .NET 5.0 support.

    Infragistics Ultimate UI for Windows Forms 21.1

    $
    0
    0
    Infragistics Ultimate UI for Windows Forms

    Adds design-time support in Visual Studio 2019 and improves Chart and Map controls.

    Features

    • Adds design-time support in Microsoft Visual Studio 2019.
    • Chart Updates
      • Orientation on ItemLegend.
      • LegendHighlightingMode for Hover/Click.
      • PlotAreaMargin <Top, Bottom, Left, Right>.
      • Added support to configure highlighting at the level of the chart rather than the individual series.
      • Compressed X-Axis labelling for the TimeXAxis and OrdinalTimeXAxis.
      • Automatically sync the vertical zoom to the series content.
      • Added support for Annotation Layers to Stacked, Scatter, Polar, Radial and Shape series.
      • Added support for highlighting to Stacked, Scatter, Polar, Radial and Shape series.
      • Added HighlightingMode for all series types.
      • Added SeriesHighlightingBehavior.
      • Added support for overriding the data source of individual stack fragments within a stacked series.
      • Added support for automatically expanding the horizontal margins of the chart based on the initial labels displayed.
      • Added support for the custom style events to Stacked, Scatter, Range, Polar, Radial, and Shape series.
      • All series with markers have a property called MarkerFillOpacity.
      • All series with markers have a property called MarkerOutlineMode.
    • Chart Defaults
      • All types of charts/series have new colors for brush/fill and outlines.
      • All types of charts/series have marker outlines with 2px thickness.
      • All types of charts/series with markers have colored marker fill instead of white fill.
      • Bar/Column/Waterfall series have outlines with 1px thickness (other series have 2px thickness).
      • Bar/Column/Waterfall series have square corners instead of rounded corners.
      • Point/Bubble/ScatterSeries/PolarScatter series have markers with 70% transparent fill.
      • Point/Bubble/ScatterSeries/PolarScatter series have markers with solid outline that matches marker fill.
      • Other series (e.g. LineSeries/ScatterLineSeries) have markers with white outlines.
      • Scatter High Density series has new colors for min/max heat properties.
      • Financial/Waterfall series have new colors for negative fill of their visuals.
    • Geospatial Map Updates
      • Support for wrap around display of the map (scroll infinitely horizontally).
      • Support for shifting display of some map series while wrapping around the coordinate origin.
      • Support for highlighting of the shape series.
      • Support for some annotation layers for the shape series.

    Infragistics Ultimate UI for Windows Forms 21.2

    $
    0
    0
    Infragistics Ultimate UI for Windows Forms

    Adds support for .NET 6 and Visual Studio 2022.

    Features

    • Added support for Microsoft Visual Studio 2022.
    • Added support for Microsoft .NET 6.0.
    • Category Chart, Financial Chart, Data Chart, and Geographic Map:
      • Added MarkerAutomaticBehavior that allows which marker type is assigned to multiple series in the same chart.
      • Added LegendItemBadgeShape for setting badge shape of all series represented in a legend.
      • Added LegendItemBadgeMode for setting badge complexity on all series in a legend.
    • Data Chart Series and Geographic Map Series:
      • Added LegendItemBadgeShape for setting badge shape on specific series represented in a legend.
      • Added LegendItemBadgeMode for setting badge complexity on specific series in a legend.
    • Category Chart and Financial Chart:
      • Added XAxisLabelLocation property to CategoryChart.
      • Added CrosshairsLineThickness and other properties for customizing crosshairs lines.
      • Added CrosshairsAnnotationXAxisBackground and other properties for customizing crosshairs annotations.
      • Added FinalValueAnnotationsBackground and other properties for customizing final value annotations.
      • Added AreaFillOpacity that allow changing opacity of series fill (e.g. Area chart).
      • Added MarkerThickness that allows changing thickness of markers.
    • Enhancements:
      • Simplified shapes of series in chart’s legend to display only circle, line, or square. This can be reverted by setting chart’s LegendItemBadgeMode property to MatchSeries enum value.
    • Geographic Map:
      • Added support for representing geographic series in a legend.

    Infragistics Ultimate UI for Windows Forms 22.1

    $
    0
    0
    Stacked chart example.

    Data Chart adds animation and transition support for stacked series.

    Features

    • Added new Data Legend component - The UltraDataLegend is a new component that works much like the Legend component, but it shows values of series and provides several configuration properties for filtering series rows and value columns, styling and formatting. This legend updates when the mouse is moved inside the plot areas of various chart controls.
    • Added new Data Tooltip Layer - The DataToolTipLayer is a new annotation layer that displays the values and titles of series as well as legend badges in a tooltip.
      • It provides several configuration properties for filtering series rows and value columns, styling and formatting.
      • The tooltip's value updates when the mouse is moved inside the plot area of various chart controls.
      • The DataToolTipLayer is now the default tooltip type for each chart controls.
    • Data Chart:
      • Added animation and transition-in support for Stacked Series. Animations can be enabled by setting the IsTransitionInEnabled property to true. From there, you can set the TransitionInDuration property to determine how long your animation should take to complete and the TransitionInMode to determine the type of animation that takes place.
    • Category Chart, Financial Chart and Data Chart:
      • Added AssigningCategoryStyle event which is now available for all series in DataChart. This is used when you want to conditionally configure aspects of series items such as fill background-color or highlighting.
      • Added new AllowedPositions enumeration property to CalloutLayer. This is used to limit where callouts are to be placed within a chart.
      • Added new corner radius properties to Annotation Layers. These are used to round-out the corners of each the callouts.
      • Added new HorizontalViewScrollbarMode and VerticalViewScrollbarMode enumeration properties to enable scrollbars in various ways. When paired with IsVerticalZoomEnabled or IsHorizontalZoomEnabled, you'll be able to persist or fade-in and out the scrollbars along the axes to navigate the chart.
      • Added new FavorLabellingScaleEnd which determines whether an axis should favor emitting a label at the end of the scale.
      • Added new IsSplineShapePartOfRange which determines whether to include the spline shape in the axis range requested of the axis.
      • Added new XAxisMaximumGap which determines the maximum allowed value for the plotted series when using XAxisGap. The gap determines the amount of space between columns or bars of plotted series.
      • Added new XAxisMinimumGapSize which determines the minimum pixel-based value for the plotted series when using XAxisGap to ensure there is always some spacing between each category.

    Infragistics Ultimate UI for Windows Forms 22.2

    $
    0
    0
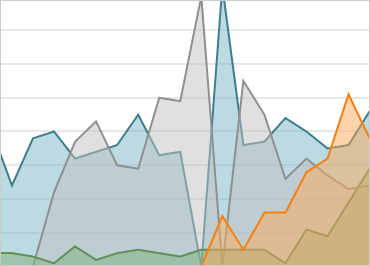
    Sample chart

    Adds new chart aggregation API for grouping and sorting.

    Features

    Chart Improvements

    • Added significant improvements to default behaviors and refined the Category Chart API to make it easier to use. These improvements include:
      • Responsive layouts for horizontal label rotation based on browser / screen size.
      • Enhanced rendering for rounded labels on all platforms.
      • Added marker properties to StackedFragmentSeries.
      • Added new ShouldPanOnMaximumZoom property.
    • Added new Category Axis Properties:
      • ZoomMaximumCategoryRange.
      • ZoomMaximumItemSpan.
      • ZoomToCategoryRange.
      • ZoomToItemSpan.
    • Added new Chart Aggregation API for Grouping, Sorting and Summarizing Category string and numeric values, eliminating the need to pre-aggregate or calculate chart data:
      • InitialSortDescriptions.
      • InitialSorts.
      • SortDescriptions.
      • InitialGroups.
      • InitialGroupDescriptions.
      • GroupDescriptions.
      • InitialSummaries.
      • InitialSummaryDescriptions.
      • SummaryDescriptions.
      • InitialGroupSortDescriptions.
      • GroupSorts.
      • GroupSortDescriptions.

    Infragistics Ultimate updated

    Infragistics Ultimate UI for Windows Forms 23.1

    $
    0
    0
    Infragistics Ultimate UI for Windows Forms

    Adds the ability to visualize a chart series as a dashed line.

    Features

    • Chart Dash Array - Now supports the ability to apply a 'DashArray' to a series to visualize them as a dashed line. The dash array can also be applied to trendlines of the series via the TrendLineDashArray property. In addition, axes now support dash arrays for axis lines and major and minor gridlines.
    • Chart Value Layer - Added a new 'ValueLayer' series type which allows you to render an overlay for different focal points of plotted data including maximum, minimum and average. This is rendered as a dashed line in the plot area of the chart.

    Important Changes to the Infragistics Product Range

    $
    0
    0

    Find out about the Infragistics updates starting December 7, 2023.

    Several Infragistics products have changed in price effective December 7, 2023. Infragistics Ultimate now includes App Builder - a cloud-based WYSIWYG tool designed to simplify user interface design and development. The new pricing for each product is shown below:

    ProductUSD ($)EUR (€)GBP (£)
    Indigo Design Essential *$495€435£385
    Indigo.Design **$1,695€1,495£1,295
    Infragistics Ignite UI$1,295€1,135£995
    Infragistics Professional$1,495€1,315£1,155
    Infragistics Ultimate$2,245€1,975£1,735
    Infragistics Ultimate UI for ASP.NET Web Forms$1,595€1,395£1,225
    Infragistics Ultimate UI for Windows Forms$1,195€1,055£925
    Infragistics Ultimate UI for WPF$1,195€1,055£925
    Infragistics Windows Forms Test Automation for IBM ***$2,995€2,635£2,295
    Infragistics Windows Forms Test Automation for Micro Focus UFT ***$2,995€2,635£2,295
    Infragistics WPF Test Automation for Micro Focus UFT ***$2,995€2,635£2,295

    Log on to ComponentSource and visit the links above to see your personalized discounted prices in your local currency.

    Prices shown are SRP for 1 Seat New Perpetual Licence with 1 year Standard Support subscription except:
    * 1 Year Annual Subscription License with Professional Support
    ** 1 Year Annual Subscription License with Enterprise Support
    *** Includes Priority Support

    Build Rich UIs for Desktop and Web with .NET 8

    $
    0
    0

    Infragistics .NET 8 support empowers developers to seamlessly integrate their UI expertise into cutting-edge .NET applications.

    Infragistics Ultimate is a comprehensive toolkit designed to streamline UX/UI creation and development across desktop, web, and mobile platforms. It offers hundreds of pre-built, high-performance UI components like grids and charts, alongside design-to-code tools for rapid prototyping, user testing, and even code generation. This enables developers and designers to create visually appealing and interactive applications faster, while its support for various frameworks and platforms ensures flexibility.

    Infragistics Ultimate UI for Windows Forms, Ultimate UI for WPF and Ignite UI for Blazor now support .NET 8. This allows developers to benefit from the performance improvements, cross-platform compatibility, and new APIs in the latest version of Microsoft's leading development framework.

    Infragistics Ultimate UI for Windows Forms, Ultimate UI for WPF and Ignite UI for Blazor are licensed per developer and are available as a Perpetual License with 1, 2 or 3 year support and maintenance subscription. See our Infragistics Ultimate UI for Windows Forms, Ultimate UI for WPF and Ignite UI for Blazor licensing pages for full details.

    For more information please visit our product pages:

    The following product suites also include Infragistics Windows Forms, WPF and Ignite UI:

    Infragistics Wins Four ComponentSource Awards

    $
    0
    0

    ComponentSource has awarded Infragistics a Top 10 Publisher Award plus three Product Awards for 2024.

    Infragistics is a software company that caters to developers and user experience professionals. It offers a comprehensive suite of UI controls and tools for building visually appealing applications across various platforms including web, mobile, and desktop. Its core product, Infragistics Ultimate, provides an extensive library of pre-built components and functionalities, such as grids, charts, and design systems, that streamline the development process and empower creation of feature-rich user interfaces. ComponentSource has been in partnership with Infragistics since 1996, helping to distribute its award-winning products to the global developer community.

    Congratulations to Infragistics on winning a Top 10 Publisher Award in the annual ComponentSource Awards for 2024, along with Top 25, Top 50, and Top 100 Product Awards. We're pleased to once again recognize Infragistics' ongoing excellence in developing high-quality components and tools.

    Each year, the ComponentSource Awards leverage real global sales data to identify the top 100 bestselling software components and development tools. This recognition not only reflects real-world adoption by developers but also provides valuable insights into current market trends and preferred solutions, making it a trusted source for gauging developer preferences. For full details on this year's awards see:

    Viewing all 64 articles
    Browse latest View live


    <script src="https://jsc.adskeeper.com/r/s/rssing.com.1596347.js" async> </script>